


Last updated: September 25, 2026
This page collects video review statistics. It covers how feedback is given, how many versions a file goes through, and what slows approvals down. It starts with original, anonymized data from Krock.io, a video review and approval platform, and adds 2024 to 2026 research from Microsoft, Atlassian, Adobe, Wistia, HubSpot and others. Every stat links to its source.
Key takeaways
- 82.4% of comments left on Krock.io are pinned to a specific timecode (Krock.io platform data, 2024 to 2026).
- Each file reviewed on Krock.io averages 2.24 versions and 4.42 comments (Krock.io platform data).
- 74% of marketing and advertising professionals say the approval process takes more effort than the creative work itself (StreamWork, 2025).
- Over 60% of marketing and creative professionals spend up to one full day a week chasing approvals (StreamWork, 2025).
- Knowledge workers are interrupted every two minutes during core hours, 275 times a day (Microsoft, 2025).
- Teams spend a quarter of the workweek searching for information (Atlassian, 2025).
- Nearly two-thirds of marketers expect content demand to quintuple between 2024 and 2026 (Adobe, 2025).
Original Krock.io data: video revision statistics
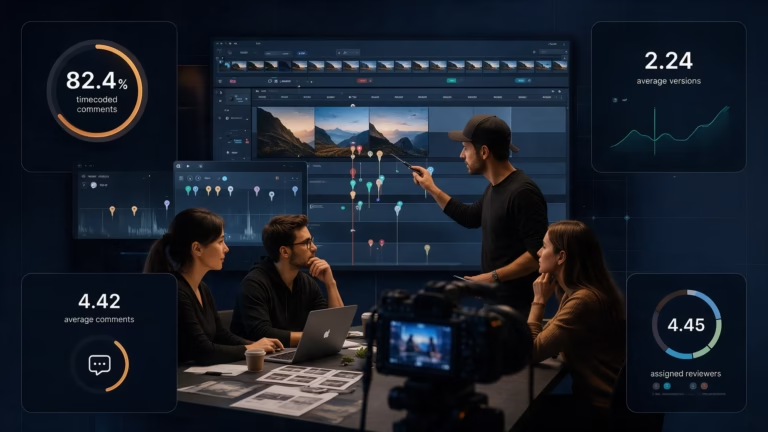
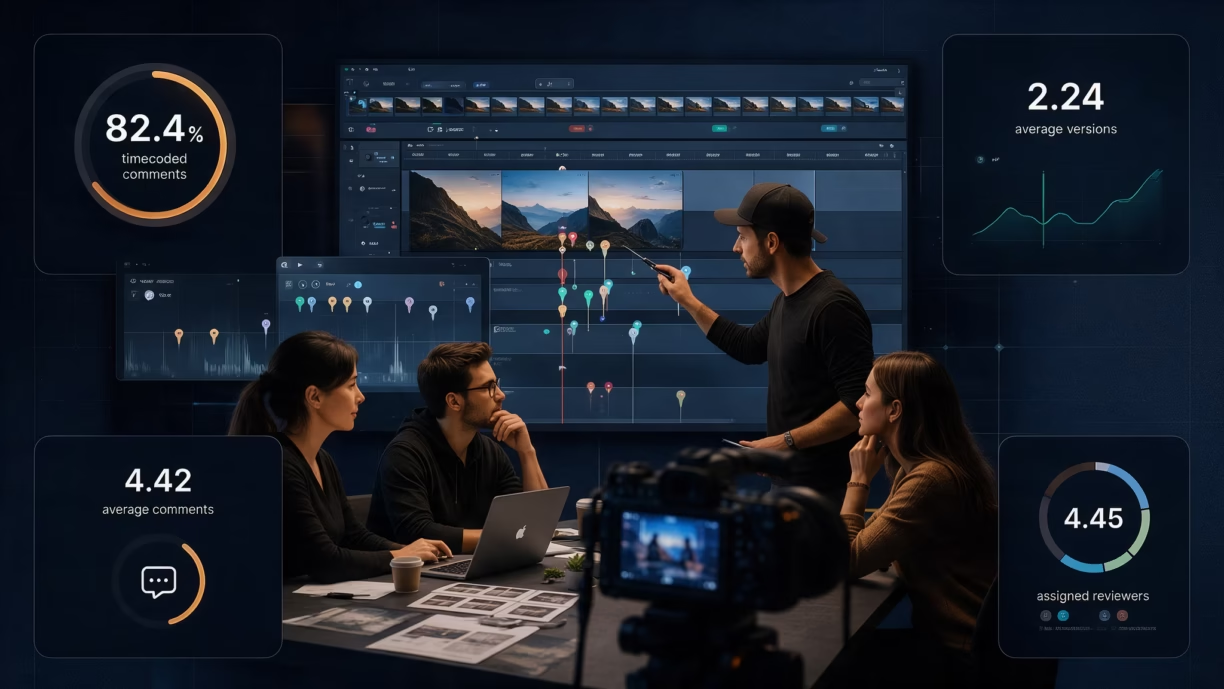
- 82.4% of comments left on Krock.io are pinned to a specific timecode (Krock.io platform data, 2024 to 2026).
- Each file reviewed on Krock.io has an average of 2.24 uploaded versions (Krock.io platform data, 2024 to 2026).
- Each file reviewed on Krock.io receives an average of 4.42 comments (Krock.io platform data, 2024 to 2026).
- Projects on Krock.io have an average of 4.45 assigned reviewers (Krock.io platform data, 2024 to 2026).
What this means: When reviewers can click on a frame, they use it. More than four in five comments point to an exact moment instead of “around the middle.” The average file needs just over two versions: a first cut and roughly one round of changes. Two of these numbers are conservative. The timecoded share includes images and PDFs, which have no timeline, and excludes comments placed at 0:00. The reviewer count includes only formally assigned reviewers, not teammates or guests reviewing through a share link.
Methodology: Aggregated, anonymized activity across all projects on Krock.io from September 2024 to September 2026, covering all file types reviewed on the platform (video, animation, images, PDFs and audio). No individual project, client or file content was accessed. “Versions” means all versions uploaded per file. “Timecoded” means a comment with a timestamp after 0:00. We don’t report approval time, because approval statuses on Krock.io are customizable per team and aren’t consistently dated.
Approval process statistics
- 74% of marketing and advertising professionals say the approval process takes more effort than the creative work itself (StreamWork and Pollfish, 2025, n=500).
- Over 60% of marketing and creative professionals spend up to one full day of their workweek chasing approvals (StreamWork, 2025).
- More than half of marketing professionals say approved content still went live with errors in the past year (StreamWork, 2025).
- Over three-quarters of marketing professionals say approval delays directly waste their team’s budget (StreamWork, 2025).
- Nearly half of marketing professionals say it’s important that review and approval tools integrate with their project management platform (StreamWork, 2025).
- Only 28% of in-house marketing and creative teams run regular project retrospectives (Cella Intelligence Report, 2025).
- 42% of in-house marketing and creative teams struggle to define performance KPIs (Cella, 2025).
What this means: These creative review statistics tell the same story: approval, not production, is where teams lose the most time. Most professionals say it takes more effort than the work itself, and errors still slip through at the end. Few teams look back at how a review went, so the same bottlenecks repeat on the next project. For a practical fix, see our guide to the creative review and approval process.
Video feedback statistics: fragmentation and communication overload
- Knowledge workers are interrupted every two minutes during core work hours, 275 times a day, by meetings, emails or chats (Microsoft Work Trend Index, 2025).
- The average worker receives 117 emails a day, and most are skimmed in under 60 seconds (Microsoft, 2025).
- The average worker receives 153 Microsoft Teams messages per weekday (Microsoft, 2025).
- 57% of meetings are ad hoc calls without a calendar invite (Microsoft, 2025).
- Nearly a third of meetings span multiple time zones, up 35% since 2021 (Microsoft, 2025).
- 48% of employees and 52% of leaders say their work feels chaotic and fragmented (Microsoft, 2025).
- Teams spend a quarter of the workweek searching for information (Atlassian State of Teams, 2025).
- 56% of knowledge workers say the only way to get the information they need is often to ask someone or schedule a meeting (Atlassian, 2025).
- 74% of executives say a lack of communication interferes with speed and quality (Atlassian, 2025).
- Fortune 500 teams waste an estimated 2.4 billion hours a year searching for information (Atlassian, 2025).
What this means: Video feedback that arrives by email, chat and ad hoc calls lands in the noisiest channels people have. It gets skimmed, buried or lost, and someone has to go looking for it later. That search time is the hidden cost of every revision round. Keeping comments on the frame and in one place removes it. Our guide on how to get client feedback on video covers how to set this up.
Version and format volume: more to review every year
- Nearly two-thirds of marketers expect demand for content to quintuple between 2024 and 2026 (Adobe, 2025, n=2,841).
- 83.5% of marketers say they are expected to produce more content in 2026 (HubSpot State of Marketing, 2026).
- 47.4% of marketers say their workload increased moderately in the past year, and 25.7% say it increased significantly (HubSpot, 2026).
- 76% of companies make at least one video a month (Wistia State of Video, 2026).
- 76% of video teams change the aspect ratio depending on where they post, and over half resize every time (Wistia, 2026).
- Vertical HD (1080×1920) video uploads on Wistia grew 24% year over year (Wistia, 2026).
- Over half of companies repurpose longer videos into social clips (Wistia, 2026).
- Vidyard users created 943,305 business videos in 2024, 88% more than the year before (Vidyard Video in Business Benchmark, 2025).
What this means: Every new format is another file to review. A single campaign now ships as a master, a vertical cut and several clips, and each version needs its own comments and approval. As volume grows faster than headcount, review time per file has to shrink. For how that plays out in short-form teams, see our short-form video statistics.
Who reviews: in-house, agency and freelance teams
- Around a quarter of companies outsource video creation to freelancers or production agencies, and outsourced production grew 7% year over year (Wistia, 2026).
- 35% of U.S. film and video editors and camera operators are self-employed (U.S. Bureau of Labor Statistics, 2026).
- 55% of marketing and creative organizations are moving toward in-house agency models, up 15% from 2024 (Cella, 2025).
- 61% of in-house marketing and creative teams use flexible staffing to scale output (Cella, 2025).
- Only 39% of in-house marketing and creative teams feel positioned as strategic partners in their organization (Cella, 2025).
What this means: Most video projects involve people from more than one company: an in-house team, an agency, a freelance editor and the client’s stakeholders. Every one of them needs access to the same cut and the same comments. That’s why external reviewers need to be able to comment without extra accounts or seat fees. For more workforce data, see our video production statistics.
AI and the review workload
- More than a third of video teams already use AI in their video workflow, most often in pre-production (Wistia, 2026).
- Captions are the most common generative AI feature video teams use, followed by dubbing (Wistia, 2026).
- 86% of creators actively use creative generative AI (Adobe Creators’ Toolkit Report, 2025, n=16,000).
- 60% of creators use more than one generative AI tool (Adobe, 2025).
- Only 5% of in-house marketing and creative professionals report strong proficiency in AI (Cella, 2025).
- 84% of consumers are concerned about AI-generated deepfakes (Sprout Social Q3 2026 Pulse Survey, n=2,250).
- Meta’s video generation ad tools reached a combined $10 billion revenue run rate in Q4 2025 (Meta Q4 2025 earnings call).
- More than 1 million YouTube channels used YouTube’s AI creation tools every day in December 2025 (YouTube, 2026).
What this means: AI makes it cheaper to produce versions, not to approve them. More AI-generated cuts, dubs and captions mean more files that a person has to check for accuracy and brand fit. Trust matters too, when 84% of consumers worry about deepfakes. Human review becomes more important as generation gets easier. See our guide to AI in video production for where AI fits in each stage.
How to use these video review statistics
The numbers point to three practical changes for any team that reviews video:
- Put feedback on the frame. Timecoded comments remove the guesswork that causes extra rounds. On Krock.io, 82.4% of comments already work this way.
- Keep every comment in one place. Email and chat are where feedback gets skimmed and lost. One review link per cut beats five channels.
- Plan for more versions, not fewer. Aspect ratios, clips and AI variants all multiply the number of files that need approval.
Krock.io brings frame-accurate comments, side-by-side version comparison and approvals into one place, with unlimited free external reviewers. For a step-by-step process, see how to manage client video revisions.
Frequently asked questions
How many revisions does a video usually go through?
On Krock.io, the average reviewed file has 2.24 uploaded versions, meaning a first cut plus roughly one round of changes, and receives 4.42 comments. That’s based on anonymized platform data from September 2024 to September 2026, covering all file types. Files with scattered feedback across email and chat typically need more rounds.
How much time do teams spend on approvals?
Over 60% of marketing and creative professionals spend up to one full day of their workweek chasing approvals. And 74% say approval takes more effort than the creative work itself, according to StreamWork’s 2025 study of 500 U.S. professionals. Over three-quarters say approval delays waste budget.
What is timecoded feedback?
Timecoded feedback is a comment pinned to an exact moment in a video, such as 0:42. It replaces general notes like “around the middle.” It removes ambiguity about which shot a reviewer means. On Krock.io, 82.4% of all comments are timecoded, based on platform data from 2024 to 2026.
Why do video approvals take so long?
Mostly because feedback is scattered. Workers are interrupted every two minutes (Microsoft, 2025) and spend a quarter of the week searching for information (Atlassian, 2025). When comments live in email, chat and calls, someone has to collect and reconcile them before the next version, and errors still slip through.
How many people review a video project?
Projects on Krock.io have an average of 4.45 assigned reviewers, according to platform data from 2024 to 2026. The real number is higher, because that figure excludes teammates viewing without an assignment and guests reviewing through a share link. Many projects also include outside agencies and freelancers.
Methodology and sources
We included only data published between 2024 and 2026. Every stat links to the organization that owns the data. We didn’t round, merge or re-calculate figures, and we left out numbers we couldn’t confirm at the original source. Krock.io platform data is reported as percentages and averages only.
Sources
- Krock.io platform data (aggregated and anonymized, September 2024 to September 2026, all file types).
- StreamWork, 2025 Approval Research Study, conducted by Pollfish (500 U.S. marketing and advertising professionals, October 7 to 22, 2025). Link
- Cella by Randstad Digital, 2025 Cella Intelligence Report (hundreds of in-house marketing and creative professionals across 25 industries, May 8, 2025). Link
- Microsoft, Work Trend Index special report: Breaking down the infinite workday (Microsoft 365 signals to February 15, 2025, plus 31,000 workers in 31 markets, June 17, 2025). Link
- Atlassian, State of Teams 2025 (12,000 knowledge workers and 200 Fortune 1000 executives, 2025). Link
- Adobe, GenStudio content supply chain announcement (survey of 2,841 marketers, February 27 to March 7, 2024, published March 18, 2025). Link
- HubSpot, 2026 State of Marketing Report (1,500+ global marketers). Link
- Wistia, 2026 State of Video Report (900+ professionals, 13M+ videos). Link
- Vidyard, Video in Business Benchmark Report (943,305 videos, 2024 data, published 2025). Link
- U.S. Bureau of Labor Statistics, Occupational Outlook Handbook: Film and Video Editors and Camera Operators (2025 data). Link
- Adobe, Creators’ Toolkit Report (16,000 creators, October 2025). Link
- Sprout Social, Q3 2026 Pulse Survey (2,250 consumers, August 2026). Link
- Meta, Q4 2025 earnings call transcript (January 2026). Link
- YouTube, CEO Neal Mohan’s 2026 letter (January 21, 2026). Link
Cite this page
Krock.io. (2026). Video review statistics 2026. Retrieved from https://krock.io/blog/video-review-statistics/
You’re welcome to use any stat on this page. Please link back here and to the original source. We update these video review statistics every quarter.