


Last updated: September 25, 2026
This page collects the most current video production statistics in one place. It covers market size, production activity, workforce and pay, animation, in-house teams, tools, AI and review workflows. Every figure links to the organization that published it, and all of it dates from 2024 to 2026. Where research firms disagree, we say so. For the marketing side (adoption, ROI and platforms), see our companion page of video marketing statistics.
Key takeaways
- The U.S. movie and video production industry is worth $38.6 billion in 2026 (IBISWorld).
- Los Angeles on-location shoot days fell 16.1% in 2025, to 19,694 (FilmLA).
- UK film and high-end TV production spend rose 22% to £6.8 billion in 2025 (BFI).
- Film and video editors earned a median $75,420 a year in 2025 (U.S. Bureau of Labor Statistics).
- 35% of film and video editors and camera operators are self-employed (BLS).
- 76% of companies make at least one video a month (Wistia, 2026).
- More than a third of video teams already use AI, mostly in pre-production (Wistia, 2026).
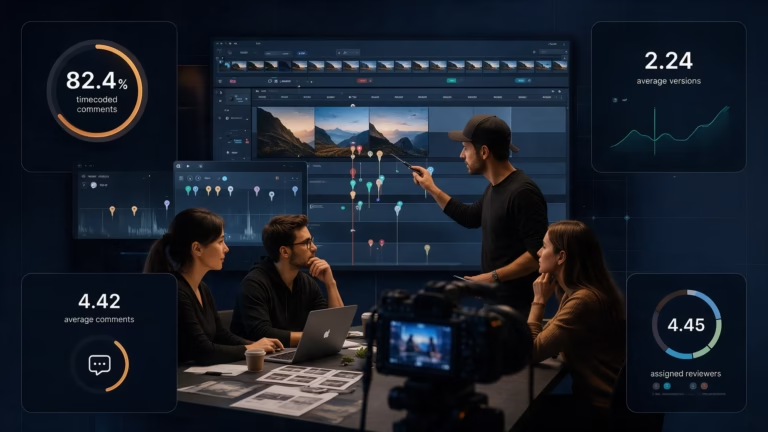
- 82.4% of comments left on Krock.io are pinned to a specific timecode (Krock.io platform data, 2024 to 2026).
Video production market statistics
- The U.S. movie and video production industry is worth $38.6 billion in 2026 (IBISWorld, 2026).
- U.S. movie and video production revenue grew 3.0% in 2026 and at a 6.4% compound annual rate between 2021 and 2026 (IBISWorld, 2026).
- The U.S. video postproduction services industry is worth $7.1 billion in 2026, after growing 4.0% in 2026 alone (IBISWorld, 2026).
- There are 3,754 video postproduction businesses in the United States (IBISWorld, 2026).
- The American film and TV industry supports 2.01 million jobs (Motion Picture Association, 2026).
- The U.S. film and TV industry is made up of more than 162,000 businesses, and 93% of them employ fewer than 10 people (Motion Picture Association, 2026).
- The global virtual production market is worth $2.10 billion in 2025 and is projected to reach $8.76 billion by 2030, a 33.1% annual growth rate (MarketsandMarkets, 2025).
- UK film and high-end TV production spend reached £6.8 billion in 2025, up 22% on 2024 (BFI, 2026).
- UK high-end TV production spend was £4 billion in 2025, up 17% (BFI, 2026).
- UK feature film production spend hit a record £2.8 billion in 2025, up 31% (BFI, 2026).
- Inward investment productions accounted for 85% of UK film and high-end TV spend in 2025 (BFI, 2026).
- 193 feature films and 168 high-end TV shows started principal photography in the UK in 2025 (BFI, 2026).
What this means: The video production market is large but made of small companies. In the U.S., 93% of film and TV businesses have fewer than 10 people. Growth is steady rather than explosive, and money is moving toward places with strong tax incentives, like the UK. Global “video production market” estimates from research firms vary by an order of magnitude depending on what they count, so compare definitions before quoting any single number.
Video production industry activity: shoot days and trends
- Los Angeles recorded 19,694 on-location shoot days in 2025, 16.1% fewer than the 23,480 in 2024 (FilmLA, 2026).
- Los Angeles on-location production rose 5.6% from Q3 to Q4 2025, to 4,625 shoot days (FilmLA, 2026).
- Los Angeles commercial production fell 23.2% year over year in Q4 2025, to 586 shoot days, and ended 35.3% below its five-year average (FilmLA, 2026).
- Los Angeles TV production fell 21.9% year over year in Q4 2025 and finished the year 50.1% below its five-year average (FilmLA, 2026).
- Los Angeles feature film production fell 19.7% year over year in Q4 2025 and finished the year 31.7% below its five-year average (FilmLA, 2026).
- FilmLA’s “other” category, which includes online content, documentaries and industrial videos, logged 2,319 shoot days in Q4 2025, down 20.4% (FilmLA, 2026).
- 119 projects were awarded incentives under California’s expanded film and TV tax credit between July and December 2025 (FilmLA, 2026).
- Incentivized projects made up about 13% of Los Angeles film and TV shoot days in Q4 2025 (FilmLA, 2026).
What this means: Traditional production hubs are shooting less, and commercials, which can’t claim California’s tax credit, are down the most. Work hasn’t vanished. It has spread out to other locations and to smaller, distributed teams. That makes remote review and approval standard practice rather than a convenience.
Video production workforce statistics
- 72,000 people worked as film and video editors or camera operators in the United States in 2025 (U.S. Bureau of Labor Statistics, 2026).
- 39,400 of those jobs were film and video editors, and 32,600 were camera operators (BLS, 2026).
- The median annual pay for film and video editors and camera operators was $75,100 in 2025, or $36.10 an hour (BLS, 2026).
- Film and video editors earned a median $75,420 a year in 2025 (BLS, 2026).
- Camera operators earned a median $74,990 a year in 2025 (BLS, 2026).
- Employment of film and video editors and camera operators is projected to grow 3% from 2025 to 2035, adding about 1,900 jobs (BLS, 2026).
- Film and video editor jobs are projected to grow 4% from 2025 to 2035, compared with 1% for camera operators (BLS, 2026).
- About 5,600 openings for film and video editors and camera operators are expected each year through 2035 (BLS, 2026).
- 35% of film and video editors and camera operators are self-employed (BLS, 2026).
- 31% of film and video editors work in the motion picture and video industries (BLS, 2026).
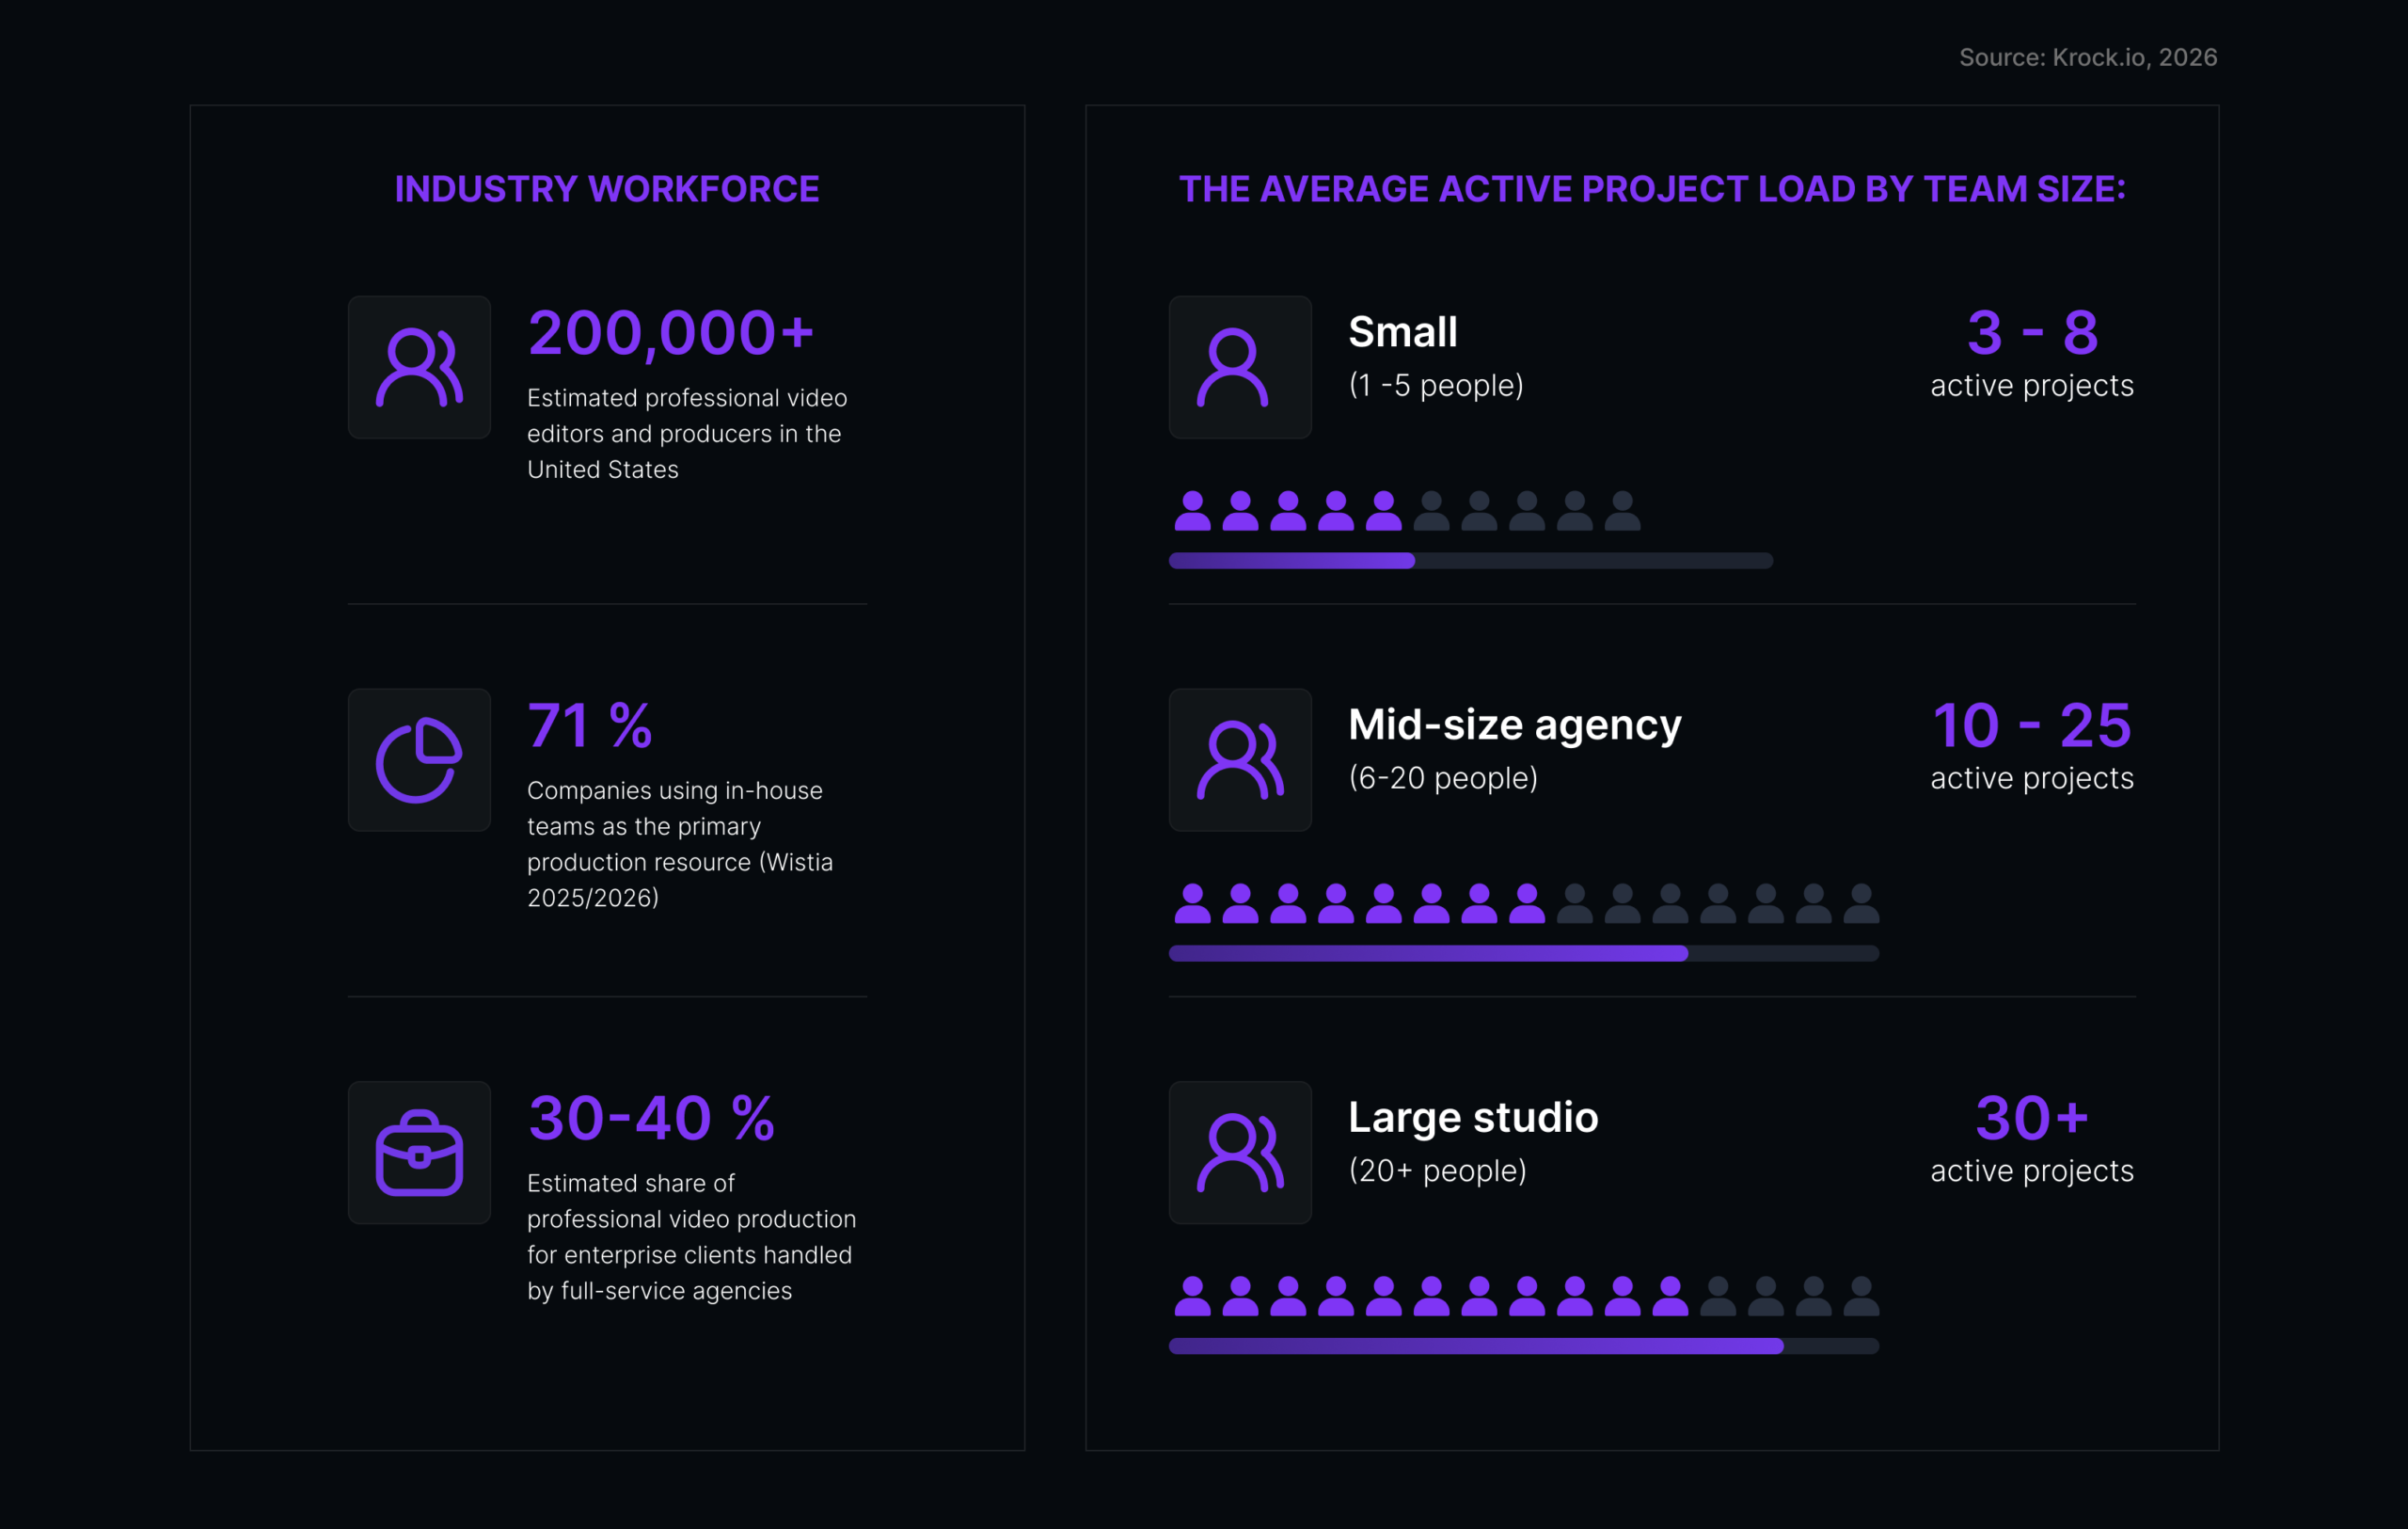
What this means: The core editing workforce is small and freelance-heavy. More than a third of editors and camera operators work for themselves, which means most productions stitch together people from different companies. For what freelancers charge, see our guides to video editor rates and freelance videographer rates.
Animation industry statistics
- The global animation market is estimated at $462.32 billion in 2025, and projected to reach $953.31 billion by 2035, a 7.52% annual growth rate (Precedence Research, 2026).
- 3D animation accounted for 44.16% of the global animation market in 2025 (Precedence Research, 2026).
- North America held 33.97% of the global animation market in 2025 (Precedence Research, 2026).
- The U.S. film animation services industry generated $387.8 million in revenue in 2025, growing at an annualized 6.3% since 2020 (IBISWorld, 2025).
- The U.S. film animation services industry has 216 businesses, and no single company holds more than 5% of the market (IBISWorld, 2025).
- One-third of The Animation Guild’s workforce was laid off in the year to July 2024 (The Animation Guild, 2024).
- 29% of animation jobs could be disrupted by generative AI within three years, according to an impact study cited by The Animation Guild (The Animation Guild, 2024).
What this means: “Animation market” figures in the hundreds of billions include games, advertising and e-learning, not just studio work. The studio business itself is small, fragmented and under pressure from layoffs and AI. Animation teams now carry more review steps per shot with fewer people, which is why storyboard, animatic and shot approvals need to move fast.
In-house and outsourced video production statistics
- 76% of companies make at least one video a month (Wistia State of Video, 2026).
- Most companies produce video in-house, and around a quarter also outsource to freelancers or production agencies (Wistia, 2026).
- Outsourced video production grew 7% year over year (Wistia, 2026).
- Companies producing 250+ videos a year are 41% more likely to use in-house teams (Wistia, 2026).
- Almost 40% of companies spent under $5,000 producing video in 2025, and just over 30% spent more (Wistia, 2026).
- 40% of companies expect to spend more on video production in 2026, while 46% plan to keep budgets flat (Wistia, 2026).
- Company size and resources, followed by cost, have been the top barriers to making more video for three years running (Wistia, 2026).
- Vidyard users created 943,305 business videos in 2024, 88% more than the year before (Vidyard Video in Business Benchmark, 2025).
- Mid-market companies averaged 267 videos each in 2024, compared with 144 for small companies (Vidyard, 2025).
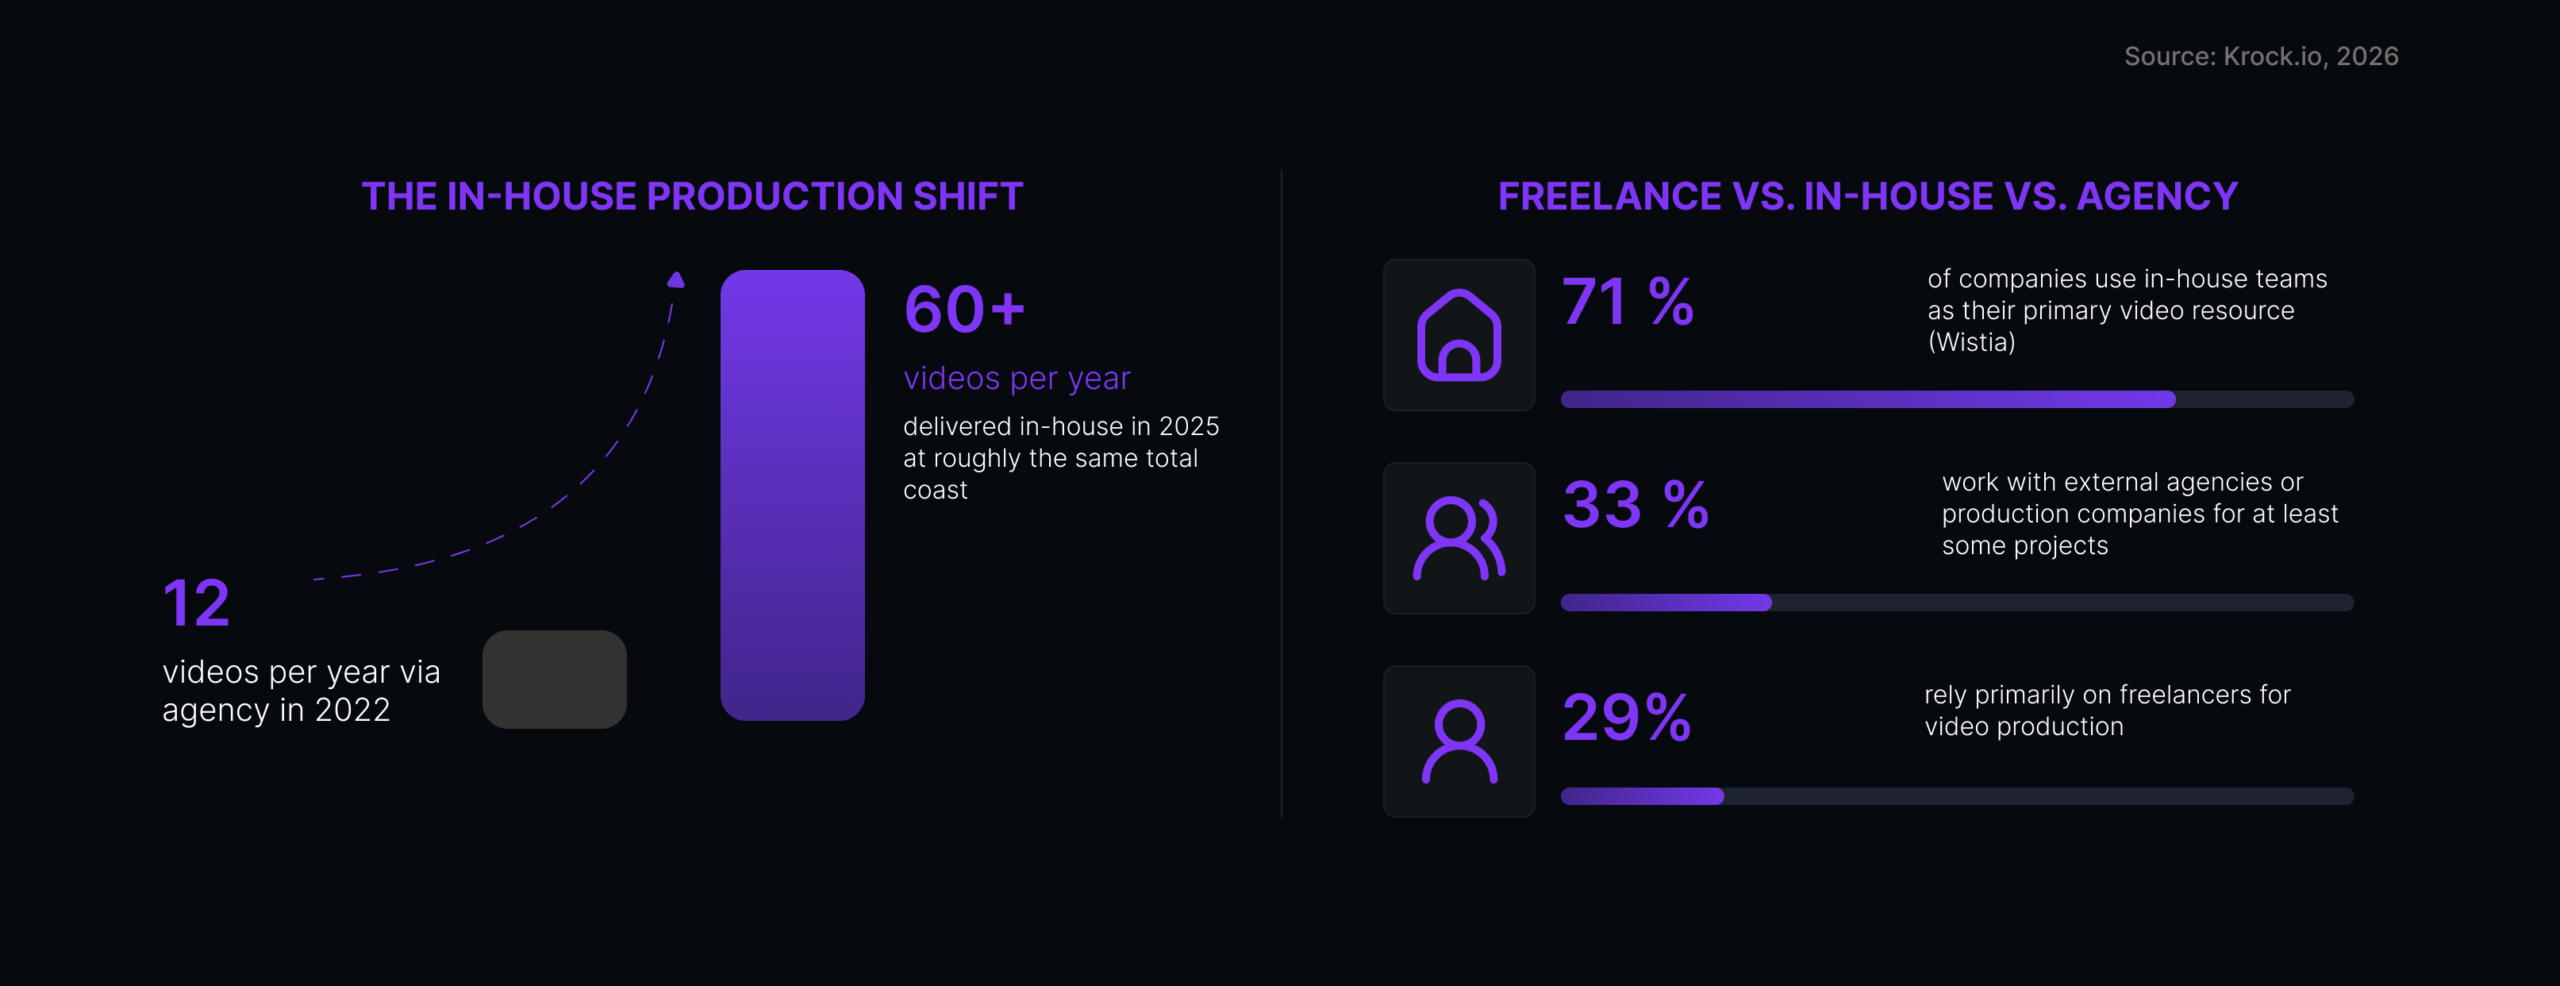
What this means: Video production is now a routine business function, and the volume sits with in-house teams. Budgets aren’t keeping pace with output, so teams make more videos for roughly the same money. Most of that pressure lands on the steps between the edit and delivery.
Video production trends: formats and tools
- 1080p is still the most common resolution for business video (Wistia, 2026).
- Vertical HD (1080×1920) video uploads on Wistia grew 24% year over year (Wistia, 2026).
- 4K uploads grew 16% year over year, while 720p fell 8% and square video fell 4% (Wistia, 2026).
- Adobe Premiere Pro is the most-used video editing tool among video teams, ahead of Canva, CapCut, iMovie and DaVinci Resolve (Wistia, 2026).
- Canva, Wistia and Loom are the most-used video recording tools among business video teams (Wistia, 2026).
- 72% of creators frequently create content on mobile devices (Adobe Creators’ Toolkit Report, 2025).
- 75% of creators expect to produce more content on mobile in the next year (Adobe, 2025).
What this means: Formats are multiplying in both directions: vertical cuts for social and 4K masters for everything else. One project now ships as several deliverables, each with its own export, review and approval. See our short-form video statistics for what that means in videos per month.
AI in video production statistics
- More than a third of video teams already use AI in their video workflow, most often in pre-production: planning, scripting and ideation (Wistia, 2026).
- Captions are the most common generative AI feature video teams use, followed by dubbing (Wistia, 2026).
- 86% of creators actively use creative generative AI (Adobe, 2025, n=16,000).
- The most common uses of generative AI among creators are editing and upscaling (55%), generating new assets (52%) and ideation (48%) (Adobe, 2025).
- 60% of creators use more than one generative AI tool (Adobe, 2025).
- 69% of creators are concerned about their content being used to train AI without permission (Adobe, 2025).
- More than 1 million YouTube channels used YouTube’s AI creation tools every day in December 2025 (YouTube, 2026).
- Meta’s video generation ad tools reached a combined $10 billion revenue run rate in Q4 2025 (Meta Q4 2025 earnings call).
- Nearly 10% of the Reels people view each day are created in Meta’s Edits app (Meta Q4 2025 earnings call).
What this means: AI is speeding up the start and the middle of production: scripts, rough assets, captions and cutdowns. It isn’t removing the review step. Faster production means more versions reach clients, so review becomes the bottleneck. Our guide to AI in video production covers which stages each tool type affects.
Video review, revision and approval statistics
- 82.4% of comments left on Krock.io are pinned to a specific timecode (Krock.io platform data, 2024 to 2026).
- Each file reviewed on Krock.io has an average of 2.24 uploaded versions (Krock.io platform data, 2024 to 2026).
- Each file reviewed on Krock.io receives an average of 4.42 comments (Krock.io platform data, 2024 to 2026).
- Projects on Krock.io have an average of 4.45 assigned reviewers (Krock.io platform data, 2024 to 2026).
- 74% of marketing and advertising professionals say the approval process takes more effort than the creative work itself (StreamWork, 2025, n=500).
- Over 60% of marketing and creative professionals spend up to one full day of their workweek chasing approvals (StreamWork, 2025).
- More than half of marketing professionals say approved content still went live with errors in the past year (StreamWork, 2025).
- Over three-quarters of marketing professionals say approval delays directly waste their team’s budget (StreamWork, 2025).
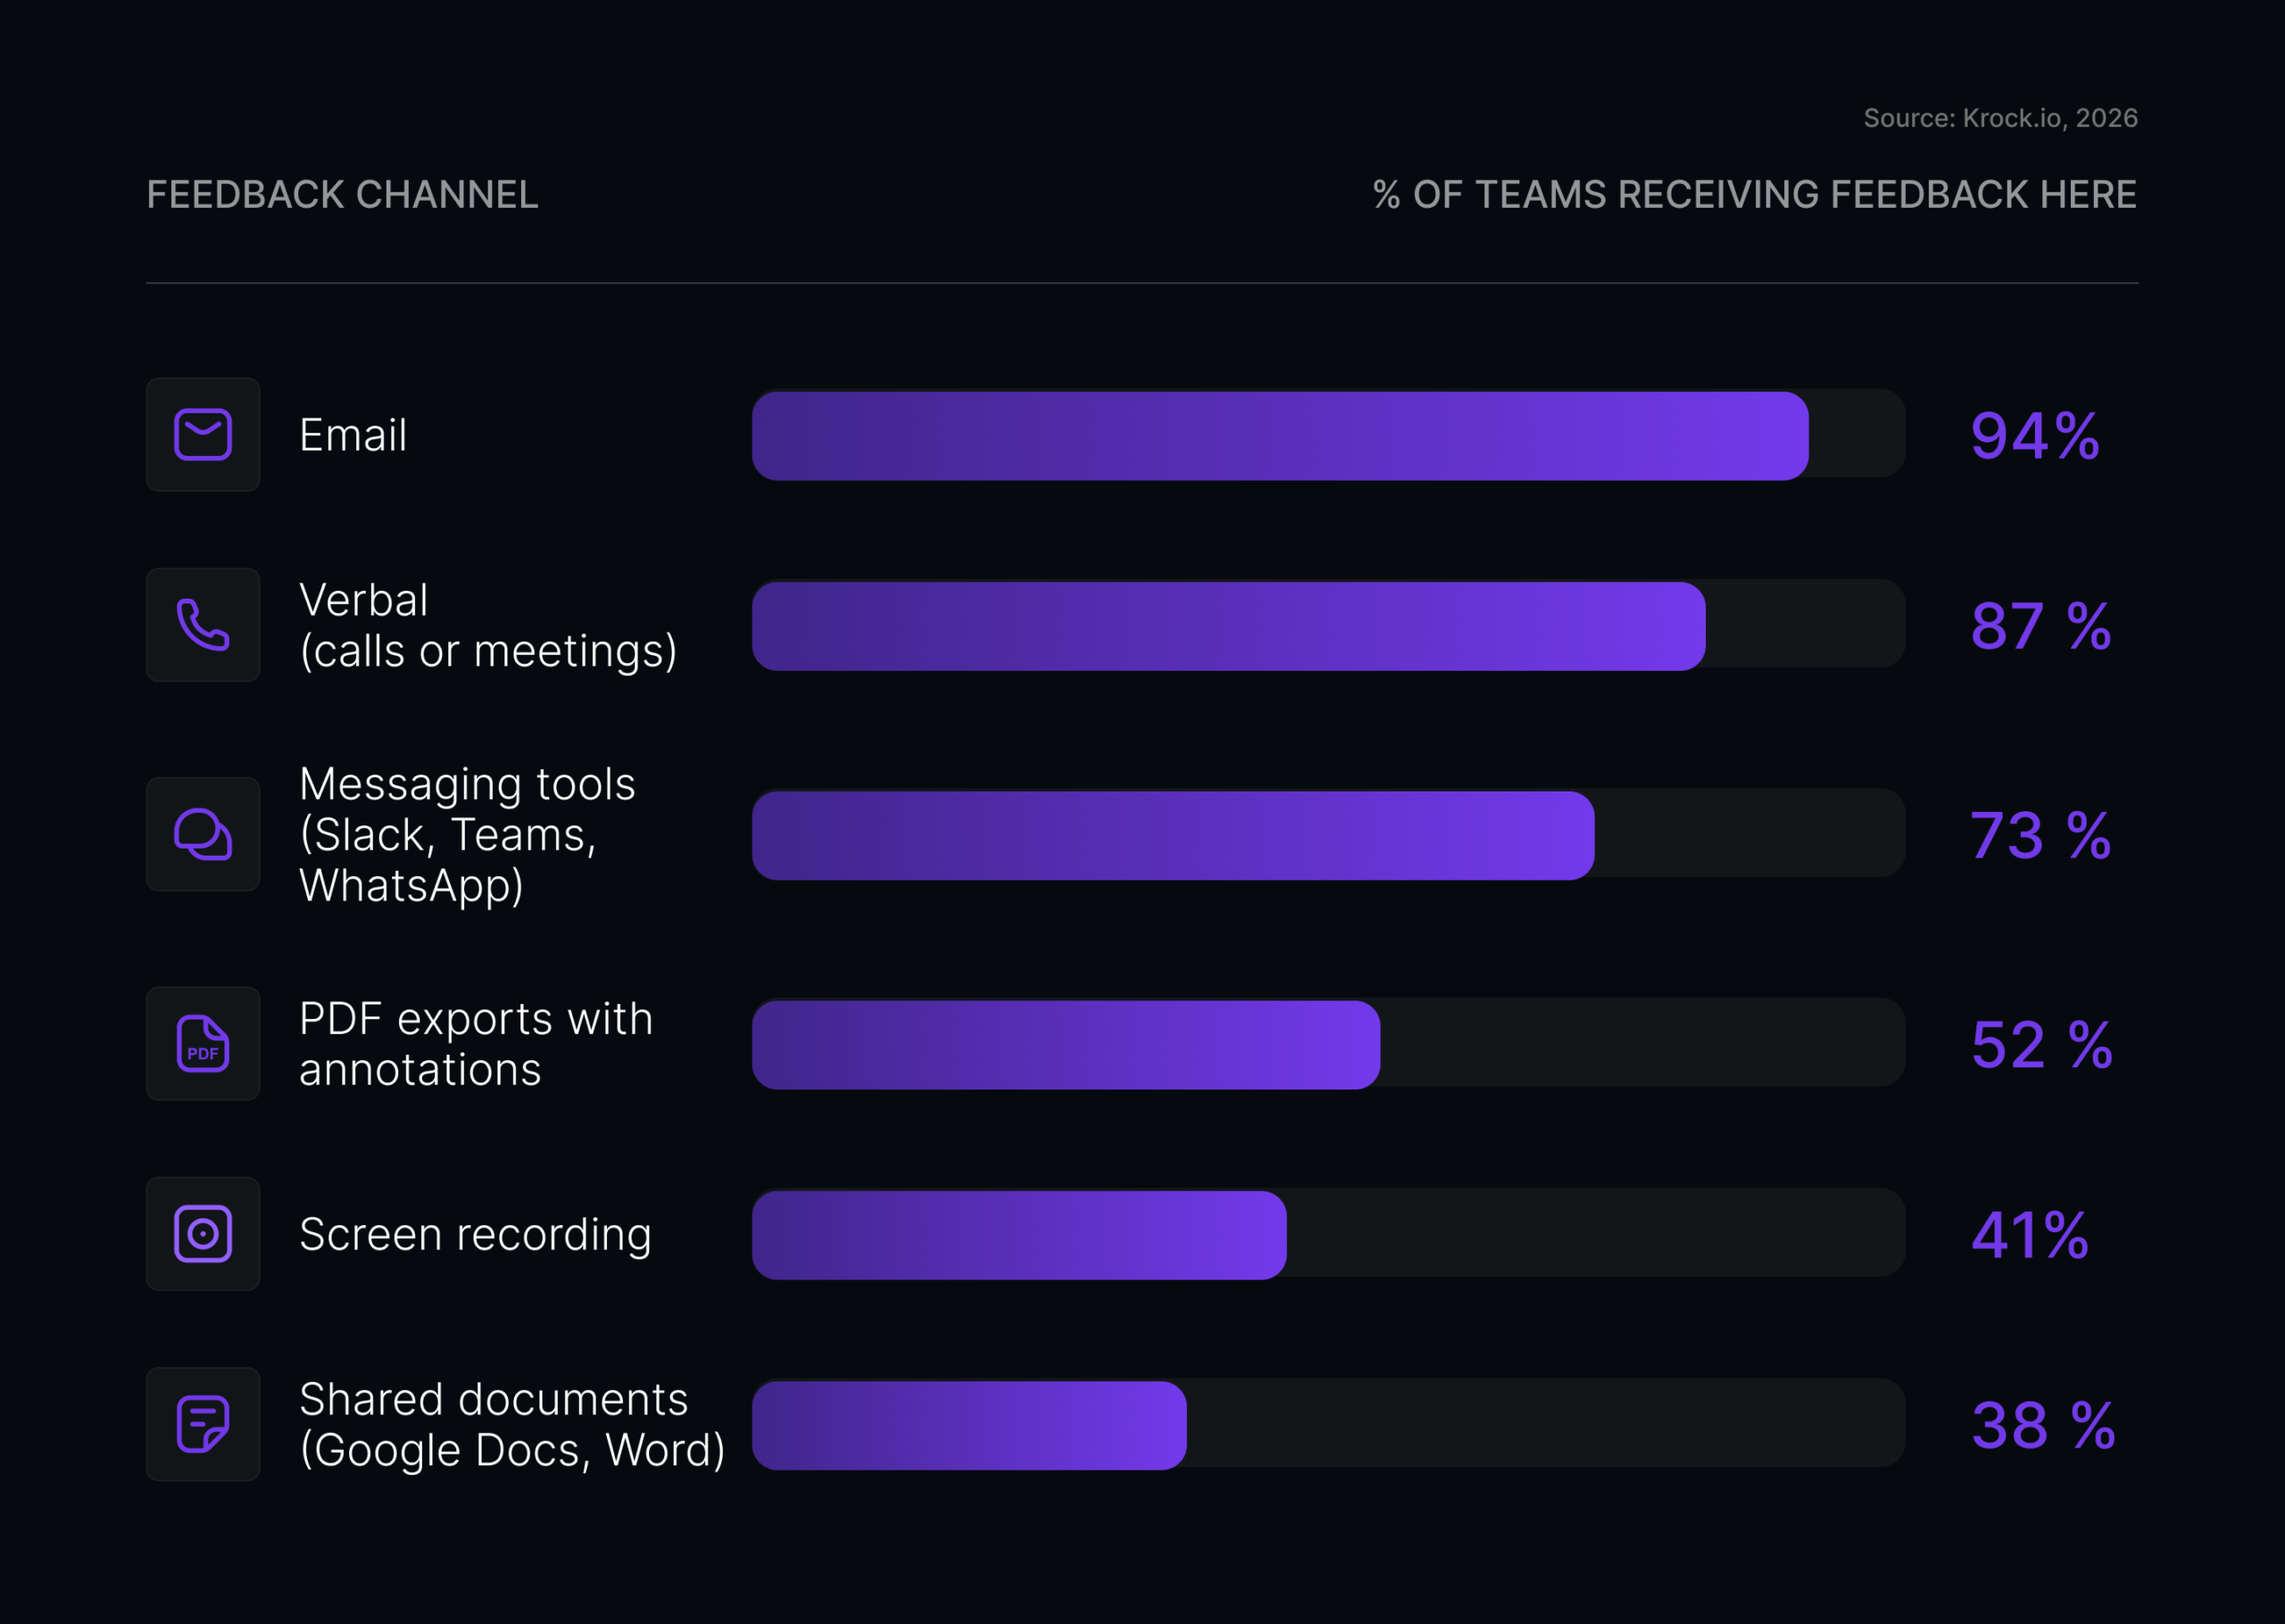
What this means: Review works when feedback lands on an exact frame. On Krock.io, more than four in five comments do, and the average file needs just over two versions. Approvals get stuck when feedback is spread across email, calls and chat threads. Our video review statistics page covers this in more detail. Krock.io keeps frame-accurate comments, version comparison and approvals in one place, with unlimited free external reviewers. For practical steps, see how to manage client video revisions and how to get client feedback on video.
Krock.io methodology: aggregated, anonymized activity across all projects on Krock.io from September 2024 to September 2026, covering all file types (video, animation, images, PDFs and audio). No individual project, client or file content was accessed. “Timecoded” means a comment with a timestamp after 0:00, so the share is conservative.
Frequently asked questions
How big is the video production industry?
The U.S. movie and video production industry is worth $38.6 billion in 2026, and U.S. video postproduction services add $7.1 billion (IBISWorld). The wider American film and TV industry supports 2.01 million jobs across more than 162,000 businesses, 93% of which employ fewer than 10 people (Motion Picture Association).
Is the video production industry growing?
Revenue is growing slowly: U.S. movie and video production grew 3.0% in 2026 (IBISWorld). Traditional hubs are shooting less, with Los Angeles on-location shoot days down 16.1% in 2025 (FilmLA). Meanwhile, UK production spend rose 22% to £6.8 billion (BFI), and 76% of companies now make video every month (Wistia).
How much do video editors make?
Film and video editors in the U.S. earned a median $75,420 a year in 2025, according to the Bureau of Labor Statistics. Camera operators earned a median $74,990. About 35% of workers in these roles are self-employed, and editor jobs are projected to grow 4% from 2025 to 2035.
How big is the animation industry?
Estimates vary widely because they count different things. Precedence Research puts the global animation market, including games and advertising, at $462.32 billion in 2025. The U.S. film animation services industry on its own generated $387.8 million, across 216 businesses (IBISWorld, 2025).
How is AI changing video production?
More than a third of video teams use AI, mostly for planning, scripting and captions (Wistia, 2026). Adoption is higher among creators: 86% use creative generative AI (Adobe, 2025). The Animation Guild cites a study estimating that 29% of animation jobs could be disrupted by generative AI within three years.
How many revisions does a video usually go through?
On Krock.io, the average reviewed file has 2.24 uploaded versions and receives 4.42 comments, based on platform data from September 2024 to September 2026. Approvals are the harder part: 74% of marketing professionals say approval takes more effort than the creative work itself (StreamWork, 2025).
Methodology and sources
We included only data published between 2024 and 2026. Every stat links to the organization that owns the data. We didn’t round, merge or re-calculate figures. We left out numbers we couldn’t confirm at the original source, including earlier versions of this page’s survey data, which we removed in September 2026.
Sources
- IBISWorld, Movie & Video Production in the US (2026). Link
- IBISWorld, Video Postproduction Services in the US (February 2026). Link
- IBISWorld, Film Animation Services in the US (November 2025). Link
- Motion Picture Association, The American Motion Picture and Television Industry (2026, 2024 data). Link
- MarketsandMarkets, Virtual Production Market (August 2025). Link
- BFI, Official statistics 2025 (February 5, 2026). Link
- FilmLA Research, Q4 and full-year 2025 report (January 15, 2026). Link
- U.S. Bureau of Labor Statistics, Occupational Outlook Handbook: Film and Video Editors and Camera Operators (2025 data, 2025 to 2035 projections). Link
- Precedence Research, Animation Market (updated September 2026). Link
- The Animation Guild, Animation industry facing major issues going into union negotiations (July 31, 2024). Link
- Wistia, 2026 State of Video Report (900+ professionals, 13M+ videos). Link
- Vidyard, Video in Business Benchmark Report (943,305 videos, 2024 data, published 2025). Link
- Adobe, Creators’ Toolkit Report (16,000 creators, October 2025). Link
- YouTube, CEO Neal Mohan’s 2026 letter (January 21, 2026). Link
- Meta, Q4 2025 earnings call transcript (January 2026). Link
- StreamWork, 2025 Approval Research Study, conducted by Pollfish (500 U.S. marketing and advertising professionals, October 2025). Link
- Krock.io platform data (aggregated and anonymized, September 2024 to September 2026).
Cite this page
Krock.io. (2026). Video production statistics 2026. Retrieved from https://krock.io/blog/video-production-statistics/
You’re welcome to use any stat on this page. Please link back here and to the original source. We update these video production statistics every quarter.